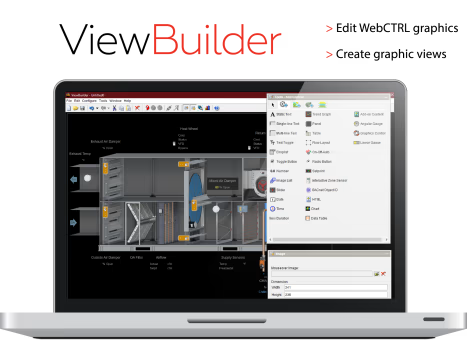
Intuitive graphical design for clear, interactive building system visualization
ViewBuilder® is a powerful graphics creation tool within WebCTRL® that enables users to design dynamic, interactive system graphics, helping operators quickly understand building performance, equipment status, and operating conditions.
Graphical design tool integrated directly within WebCTRL®
Supports vector‑based graphics for scalable, high‑quality visualization
Compatible with WebCTRL® controllers, alarms, trends, schedules, and reports
Supports binding of:
Live system points
Alarm states
Status indicators
Trend data
Graphics created in ViewBuilder® are instantly available within the WebCTRL® user interface once saved.
Our experts can help you choose the right commercial, residential, or light commercial HVAC solution from Carrier, Toshiba, and Viessmann.
ahi@ahi-carrier.com
+971 650 45700
Sharjah Research Technology and Innovation Park First Floor, Wing B – Sharjah United Arab Emirates
Fields marked * are required. We respond within one business day.

 Australia
 New Zealand
 Greece